Tree Canopy Cover by Metro Area - Visualizing high-res geospatial data in Python
This post illustrates how to interactively render high-res geospatial data in Python, and investigates which urban areas have the highest and lowest urban tree cover. Measuring TCC is important for many reasons, including predicting electrical outages, modelling housing prices, and tracking climate change.
Note - As of March 2020 this blog post is somewhat in progress
Data Documentation, code, and instructions to reproduce this analysis are available on my Github.
I uploaded the processed data on Kaggle Datasets, including a Notebook to run this analysis
Background
Tree Canopy Cover (TCC) is a measure of the vegetation cover of an area.
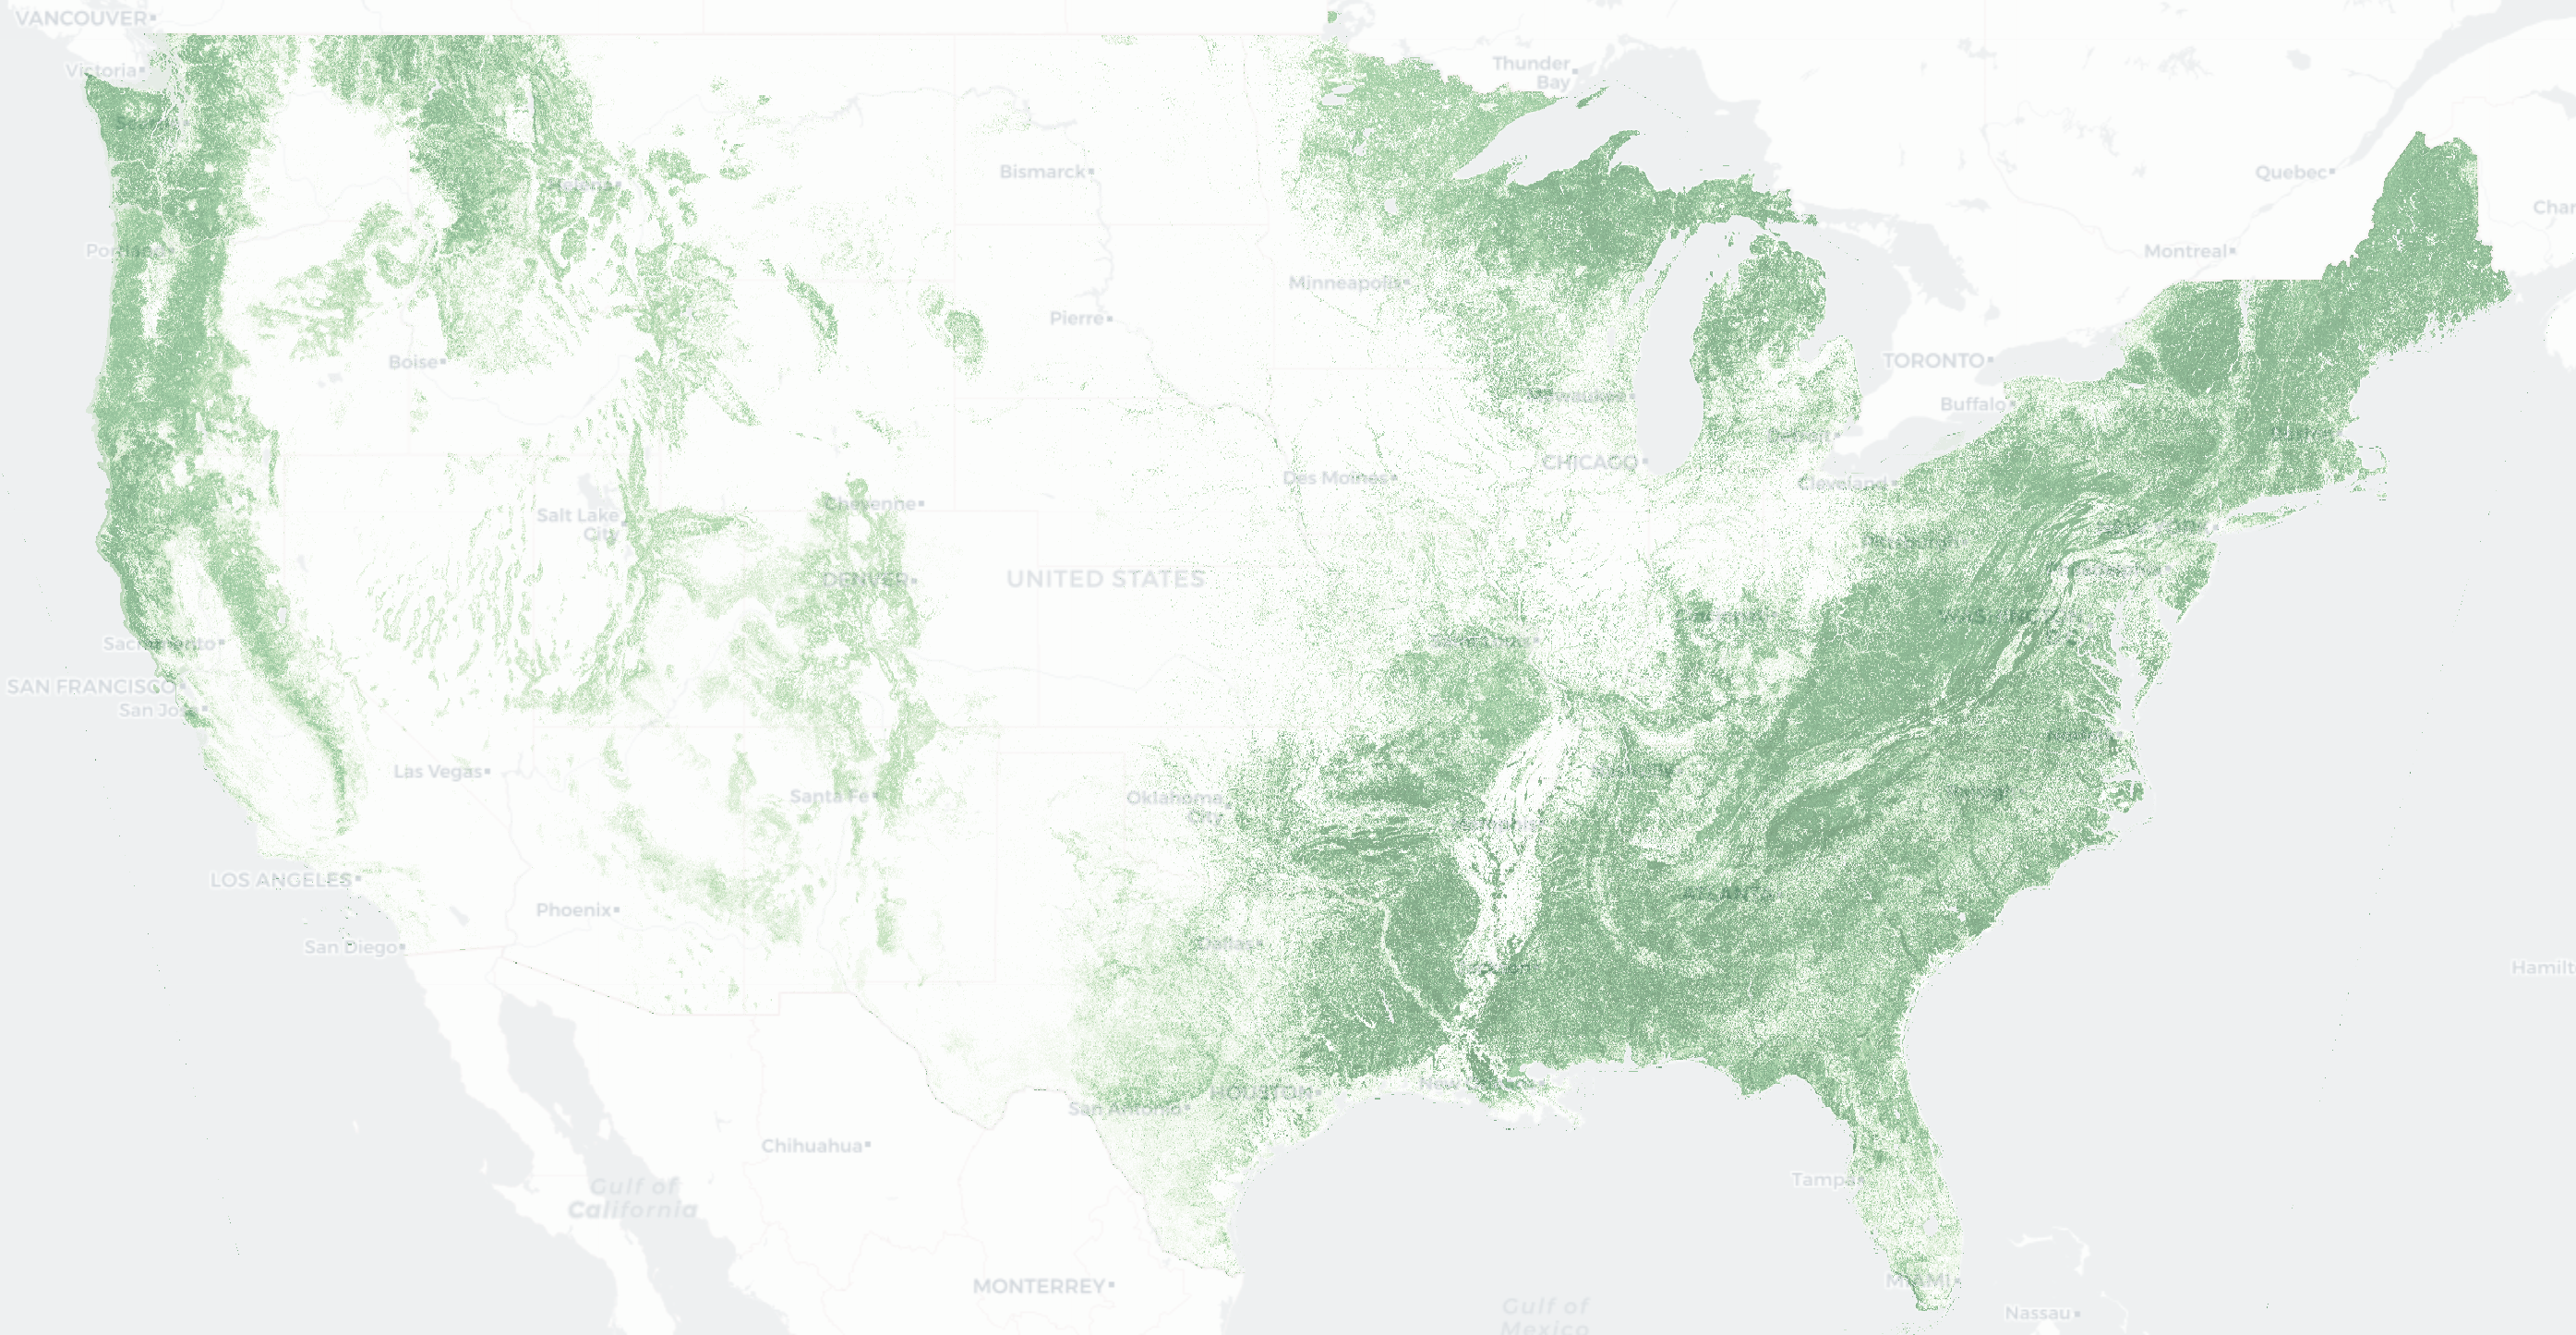
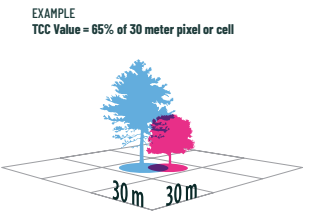 Every 4 years, the USFS publishes TCC estimates for every 30x30 meter pixel in the United States. I downloaded the 2016 data and compressed it to 1km pixels for ease of analysis. For background on TCC, see the USFS Tree Canopy Cover brochure
Interactive visualization of high-density geospatial raster data in Python
Folium is a popular Python library that combines the dynamic Leaflet geospatial library with the data manipulation prowess of Python. Most visualizations using Folium use point data or choropleths (data tied to specific polygons). However, the TCC data has millions of pixels, which quickly overloads the normal Folium polygon functions. Fortunately, using the folium.raster_layers.ImageOverlay with the raw numpy matrix allows quick rendering while maintaining the interactive Leaflet tiles.
This article will show how to use Folium raster layers to visualize high-resolution geospatial tree canopy cover data.
Click here for the interactive version of this map, including shapefiles.
Tree Canopy Cover by Metropolitan Area
City boundary shapefiles and census population data were downloaded from https://catalog.data.gov/dataset/500-cities-city-boundaries-acd62.
TCC was aggregated within the boundaries of the 50 most populous cities, and analyzed in conjunction with derived population density.
Click here for the interactive version of this plot.
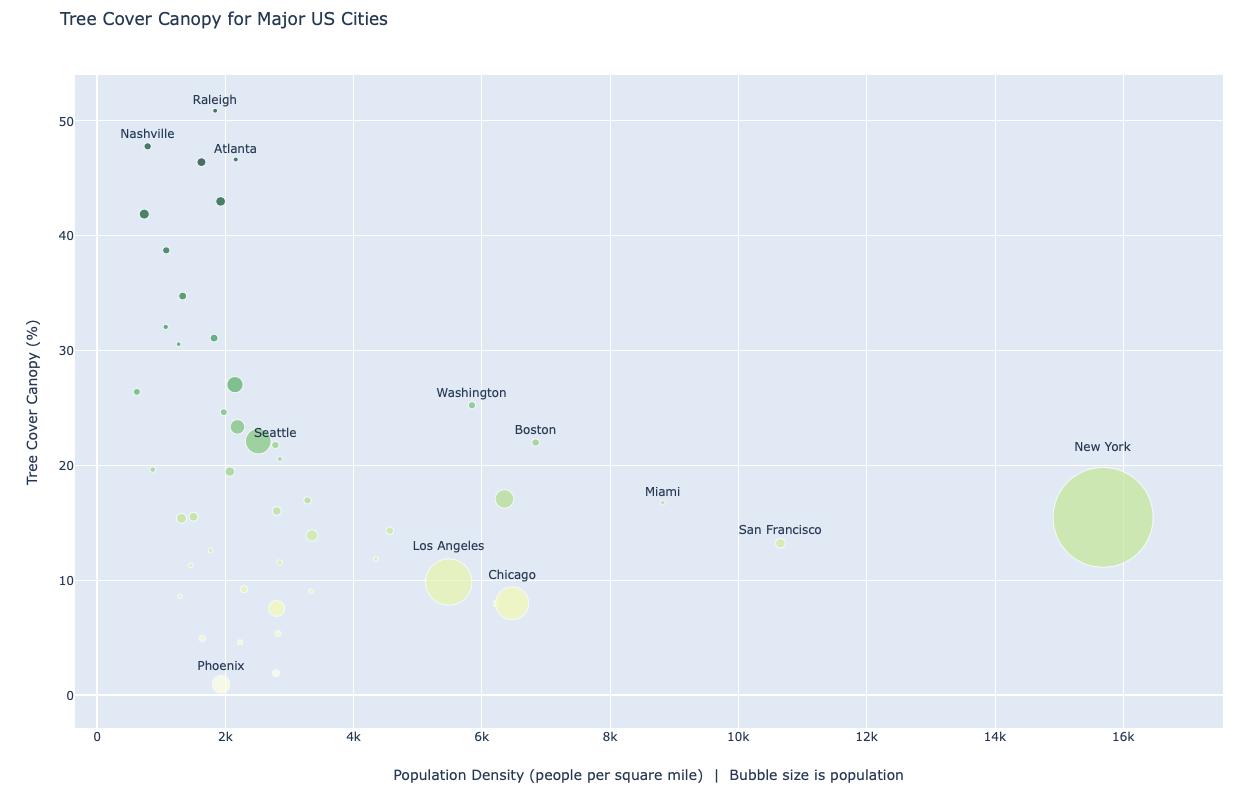
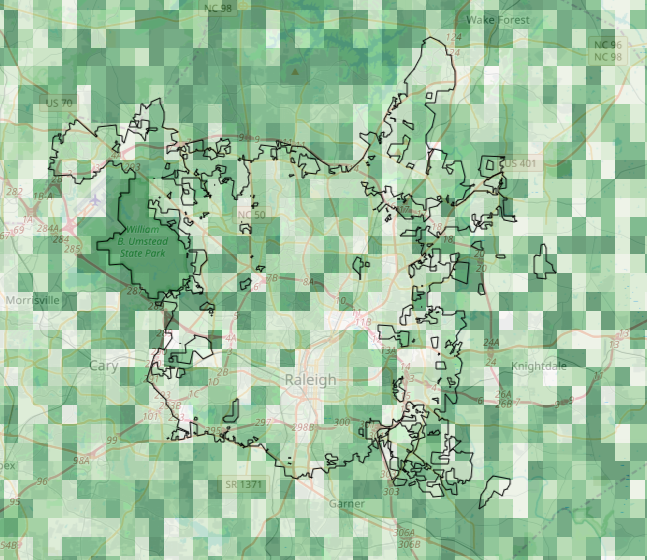
Take these rankings with a grain of salt. For example, here is the zoomed-in map of the highest tree-cover city, Raleigh. As you can tell, city boundaries are quite arbitrary. In this case, the inclusion of William B Umstead State Park in the city limits is certainly boosting the overall TCC value.