CDC COVID-19 case reporting delays
One of the challenges of modelling and responding to pandemics is real-time, reliable case data. Here, I quantify and visualize the magnitude of reporting delays of COVID-19.
Motivation
COVID-19 case counts are notoriously difficult to ascertain, largely due to the extensively documented testing bottlenecks. Largely for that reason, the prominent models for when the US will “flatten the curve”, such as the IHME model focus on deaths, which are more consistently reported. However, I wanted to interrogate the CDC case data to answer a few key questions:
1) What is the reporting delay of COVID-19 cases?
2) How many cases did the US have in March, and when will we know that total?
Data
The CDC website charts cases by onset, stating that cases in the last 11 days are not fully reported.
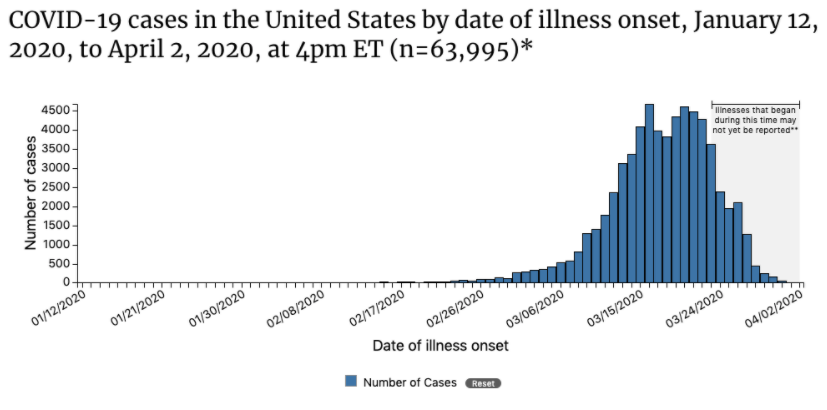
The CDC updates this chart every weekday. For the last 1-2 weeks, I’ve been scraping the raw json data from this chart. I saved this data, along with all processing & analysis code, in this Github repo.
For this analysis, I used data files through April 9.
Analysis
First, I recreated the CDC plot from April 2, and overlaid it with the data from a week later (April 7).
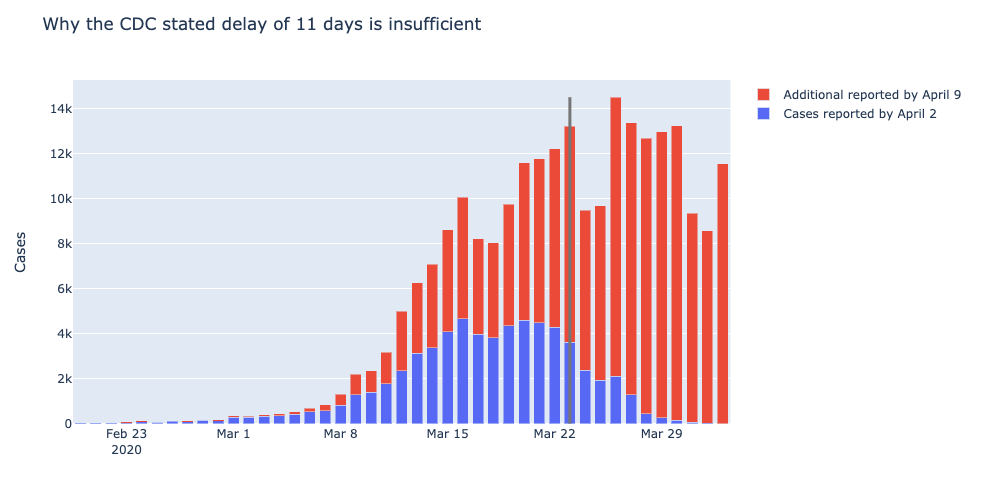
Indeed, there are many cases reported that were contracted well before the CDC’s 11 day reporting window.
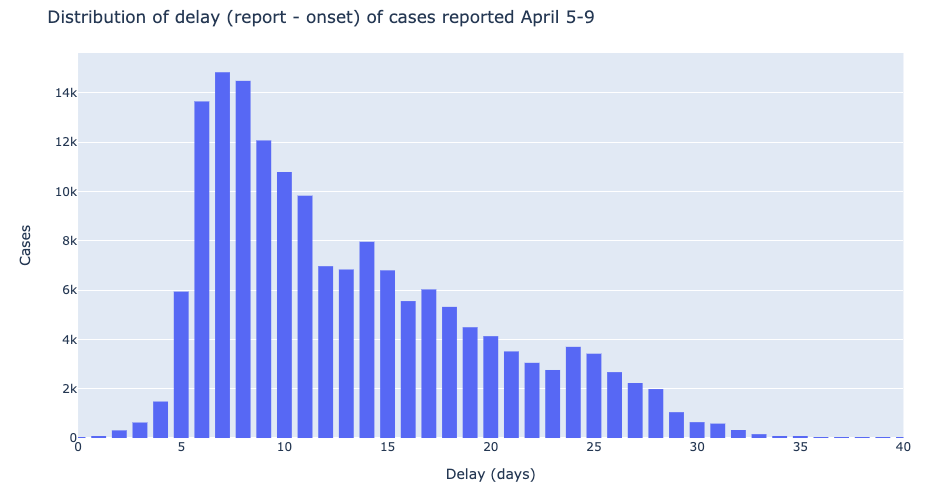
Using the cases added to this chart the week of April 5-9, I derived the distribution of case-level reporting delays. The median delay is 11 days, with many reported 2-3 weeks after illness.
Finally, I used the cumulative distribution of reporting delay to calculate the proportion of cases each day of March that are still unreported (assuming constant reporting delay - I hope verify this in subsequent analyses).
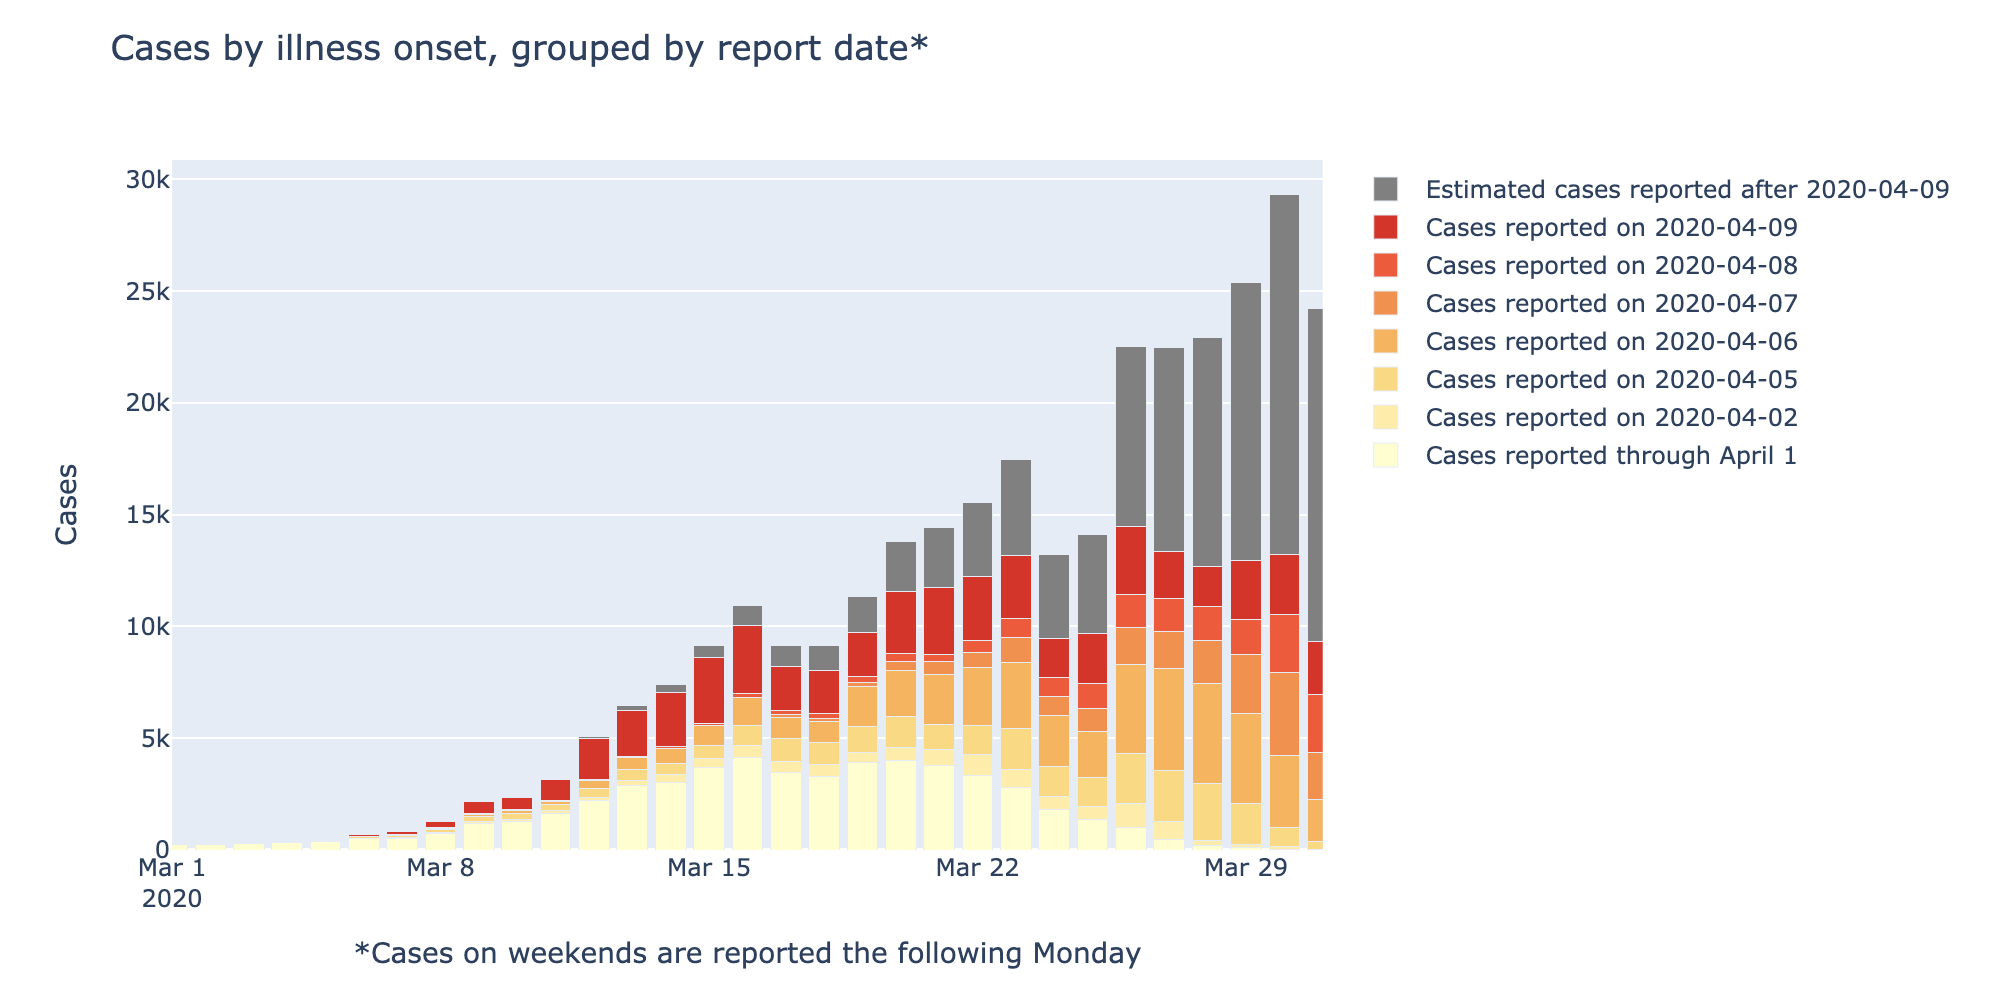
If these trends hold, I estimate that the CDC will eventually report 316,693 cases. Only 52,929 (17%) of these were reported by April 1, and 97,335 (31%) will be reported after April 9.
Conclusions
I showed these results by some leading experts (and former colleagues) at the Institute for Health Metrics. They agreed it is a compelling display of the magnitude of data inconsistency, and confirmed that these delays are well-known to those in the field.
I plan to continue scraping this data, to keep an eye on trends in reporting delays, which might help identify inflection points in the infection curve.
Lastly, it’s worth noting that state and local data is often more thoroughly reported than national CDC data. For example, see Colorado Department of Public Health & Environment’s website.